From the first of the year through March, the number of users visiting the Knowledge Base increased by 14.4%! As part of our efforts to assist financial employees and promote documentation, the monthly Banno Statement now includes a section dedicated to featuring docs. Since January, the monthly statement has been highlighting documentation for both new features and previously released features that hadn’t yet been covered. We see our efforts paying off!
Let the doc team know if you have feedback, questions, or want additional info in future updates.
Audience/User Overview
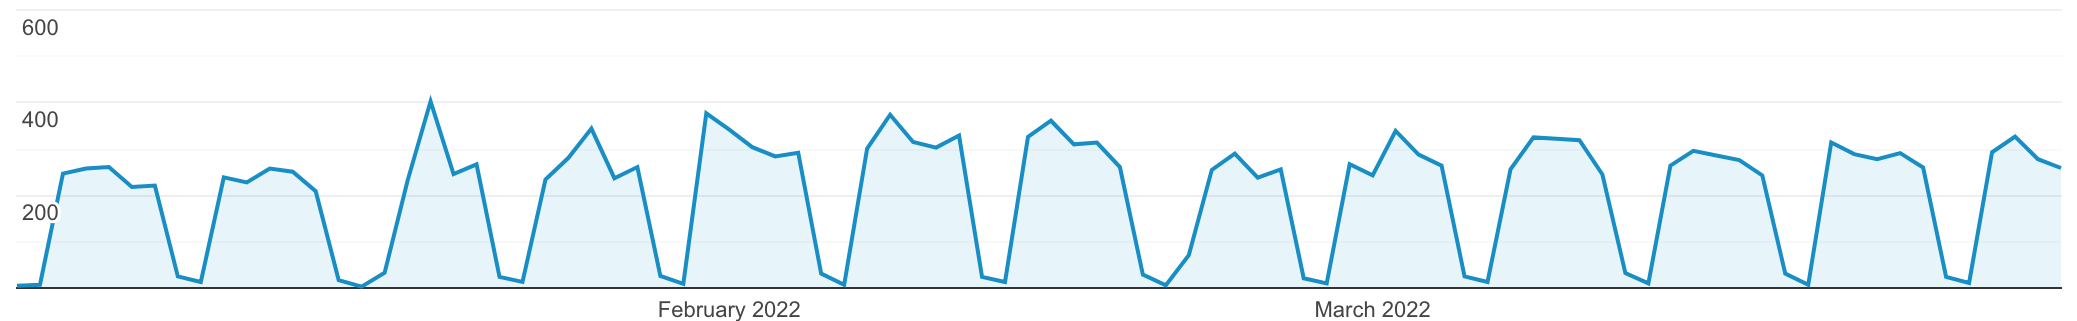 Number of daily users from January-March
- Users: 10,589
- New users: 8,496
- Sessions: 20,954
- Pageviews: 66,723
- Pages per Session: 3.18
- Avg. Session Duration: 2 minutes 38 seconds
- From January 1 to March 31, the number of users grew by 685 (+14.4%).
- January: 3,896 users
- March: 4,554 users
- Average 4,170 users per month
- Most visited weeks:
- 1,375 users between February 6-12
- 1,362 users between January 30 - February 5
- Most visited days:
- 403 users on Wednesday, January 19
- 377 users on Monday, January 31
7 Day Active Users
- Average 7 day active users: 1,217
- Highest 7 day active users: February 14 - 1,401
- Lowest 7 day active users: January 17 - 858
Top Three Visited Pages
After the homepage, the top three most popular pages include:
- /people/ - 4,852 pageviews
- /people/authentication/ - 4,004 pageviews
- /support/inbox/ - 3,251 pageviews
- These pages continue to be the top three most visited.
How many users have visited the site?
Since using Google Analytics starting in August 2020, we’ve had 37,796 users visit the Knowledge Base.