As we reflect on the second quarter, here are a few noteworthy comments.
- The number of users grew by 7.9%!
- We reorganized the institution dashboard to align with the Knowledge Base sidebar navigation and reflect traffic usage. This included adding a Mobile & Online section and replacing a few page links with top visited pages.
- April 5 was the second most visited day in the quarter. We believe this was the result of a service interruption that impacted both Banno Enterprise and Consumer facing apps. The interruption and restored emails went out in the afternoon, so we believe institutions checked the Knowledge Base in the time leading up to and during the interruption. If our hypothesis is correct, it’s GREAT seeing users self-serve by turning to the Knowledge Base with questions and concerns!! On the homepage, we plan to make the System status card more prominent so institutions can quickly check for any interruptions.
Let the doc team know if you have feedback, questions, or want additional info in future updates.
Audience/User Overview
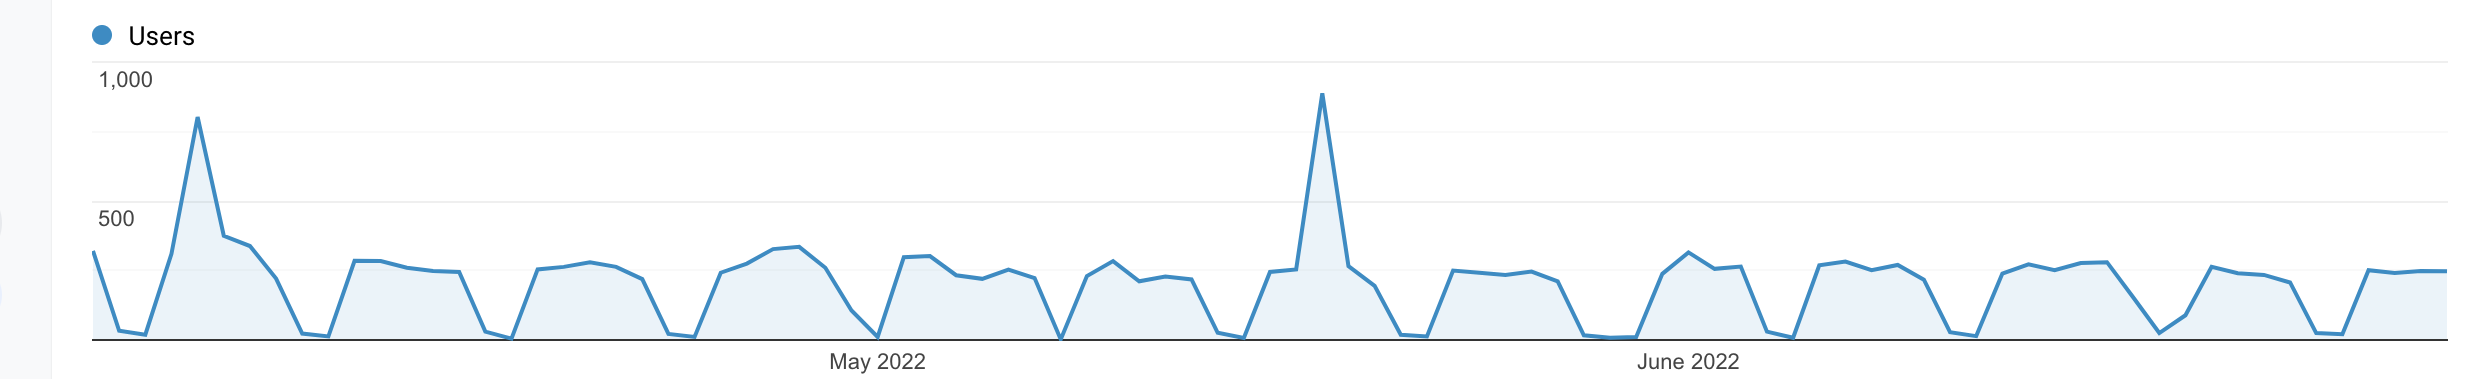 Number of daily users from April-June
- Users: 11,431 (+7.9%)
- New users: 9,147 (+7.7%)
- Sessions: 21,319 (+1.7%)
- Pageviews: 63,085 (-5.5%)
- Pages per Session: 2.96
- Avg. Session Duration: 2 minutes 16 seconds
- From April 1 to June 30, the number of users decreased by 14.3%.
- April: 4,788 users
- May: 4,416 users
- June: 4,099 users
- This could be a spring/early trend, and site usage is still higher compared to this time last year. In 2021, the second quarter decreased by 32.2%, with overall site usage spiking in April because of the institution dashboard reorg and returning to “normal” usage in the following months–3,768 users in May and 3,773 users in June.
- Average 4,434 users per month
- 6.3% higher than first quarter
- Most visited weeks:
- 1,844 users between April 3-9
- 1,675 users between May 15 - 21
- Compared to last quarter, the most visited week was 34% higher.
- Most visited days:
- 887 users on Wednesday, May 18
- 802 users on Tuesday, April 5
- Compared to last quarter, the most visited day was 120% higher.
7 Day Active Users
- Average 7 day active users: 1,034
- Highest 7 day active users: Thursday, April 7 - 1,936
- Lowest 7 day active users: Monday, May 29 - 827
Top Three Visited Pages
The site had 47,019 unique pageviews. After the homepage, the top three most popular pages include:
- /people/ - 4,283 pageviews
- /apps/accounts/ - 3,567 pageviews
- /people/authentication/ - 3,228 pageviews
How many users have visited the site?
Since we started using Google Analytics in August 2020, we’ve had 47,510 new users visit the Knowledge Base.