We’re off to great start in 2023 with traffic up 51.3% percent from the start of 2022! It was a busy first quarter with customers wanting information on transaction enrichment, UI changes to the Online and Mobile login screen (sign in with a passkey), AND Finicity’s third-party account aggregation. With those docs published on the Knowledge Base, it is more than the usual number of eyes and clicks.
Customer-facing net new docs for Q1 include:
- Transaction enrichment (2,738 pageviews)
- Sign in with passkey (507 pageviews)
- Link an account from another institution (97 pageviews); published end of Q1 and the Statement was emailed the day before Q2 began
Let the doc team know if you have feedback, questions, or want additional info in future updates.
Audience/User Overview
Total Traffic
In figure 1, traffic to the site is up 51.3% from last year’s Q1.
Figure 1 | Number of users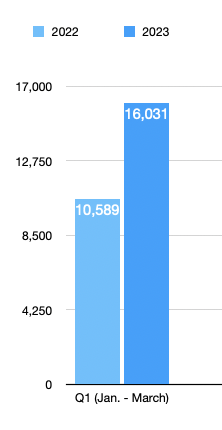
Here’s an overall comparison as the number of users and their engagement continues to increase:
| '23 first quarter | Compared to '22 fourth quarter (last quarter) | Compared to '22 first quarter | |
| Users | 16,031 | +25.9% (12,733) | +51.3% (10,589) |
| New users | 13,655 | +29.9% (10,511) | +60.7% (8,496) |
| Sessions | 31,948 | +47.5% (21,649) | +52.4% (20,954) |
| Pageviews | 87,927 | +49.1% (58,939) | +31.7% (66,723) |
| Pages per session | 2.75 | +1.1% (2.72) | -13.5% (3.18) |
| Average users per month | 6,195 | +29.4% (4,785) | +48.6% (4,167) |
| Most visited day | 537 users | −2.7% (552) | +33.2% (403) |
Additional analytics to be aware of include the following:
- Average session duration: 2 minutes 27 seconds
- Most visited weeks:
- 1,971 users between March 5 - March 11
- 1,961 users between February 26 - March 4
- Compared to last quarter (Q4 2022), the most visited week was 25% higher. With the highly anticipated transaction enrichment and UI changes on the Banno login in screen (sign in with passkey), these changes were affecting all Banno institutions. Key dates to keep in mind include:
- Published customer-facing transaction enrichment doc on January 30.
- Published the January Banno Statement on Tuesday, January 31.
- Within a week after the Statement was published, the Transaction enrichment doc was the second most popular doc (excludes the home page) with 363 page views. Accounts was the most popular.
- Within the two weeks after the Statement was published, the Transaction enrichment doc was still the second most popular doc (excludes the home page) with 790 pageviews. Accounts was the most popular.
- Published customer-facing sign in with passkey doc on February 22.
- Garnered 133 pageviews within five days of publishing, and it was the ninth most popular doc on the Knowledge Base.
- Published the February Banno Statement on February 28.
- Within a week after the Statement was published, the Sign in with a passkey doc was the ninth most popular doc (excludes the home page) with 192 pageviews.
- Within the two weeks after the Statement was published, the Transaction enrichment doc was the fourteenth most popular doc (excludes the home page) with 269 pageviews.
- Published the customer-facing Link an account from another institution doc on March 23.
- Garnered 31 pageviews within three days of publishing. The March Statement was emailed Friday, March 31.
- Most visited day: There were 537 users on Thursday, February 16. On February 13, Engineering deployed UI changes to the Banno App login screen. Verbiage about signing in with a biometric was updated to display Sign in with a passkey. Support began receiving questions, and the change likely drove customers to the Knowledge Base looking for information.
- Four additional dates with 500+ users include the following:
- 530 users on Wednesday, March 1
- 517 users on Tuesday, March 7
- 504 users on Tuesday, March 14
- 516 users on Tuesday, March 21
- In February and March, emails about the transaction enrichment roll-outs (two separate dates) were were communicated and likely drove customers to the Knowledge Base throughout the months to learn about the changes. The roll-outs were originally planned for February before they were pushed back to March and then ultimately rolled back for re-release in late 2023.
- Four additional dates with 500+ users include the following:
Visitor Acquisition Types
The vast majority of visitors accessed the site through direct traffic. The following chart details the traffic sources for the site during the fourth quarter:
Figure 2 | Number of users by acquisition type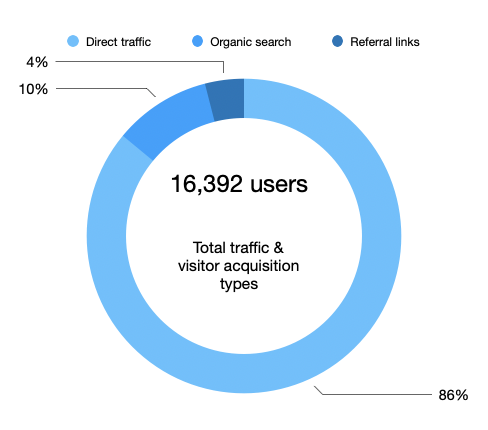
Descriptions for each acquisition type shown in Figure 2 include:
- 16,392 users
- Direct traffic: 14,035 users typed the website address into the URI bar or clicked on a link to the Knowledge Base.
- Organic search: 1,654 users accessed the website via our links in search results.
- If we were to ever have the resource availability, we could probably rank high for valuable search terms by leveraging SEO.
- Referral links: 700 users accessed the website via another source (often non-Google ads).
- Social: 3 users accessed the website via a link on social media (2 StackOverflow and 1 Google Groups).
Observations
- The number of users displayed (16,392 users) is more than the 16,031 users that Google analytics reports. This is likely because Google Analytics has different methods for counting and delivering data.
- The majority of users continue to visit the Knowledge Base via direct traffic and is +23.5% higher than last quarter.
Device Type
Figure 3 shows that the majority of users accessed the site via desktop:
Figure 3 | Device used to access the site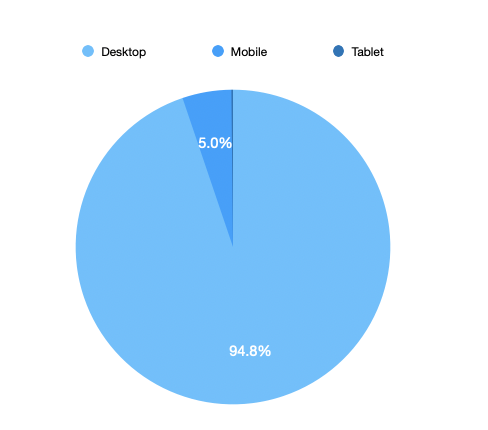
The breakdown of the 16,066 users using a specific device includes:
- 15,231 users via desktop
- 808 users via mobile
- 27 users by tablet (.17%)
Observations
- The number of users displayed (16,066 users) is less than the 16,031 users that Google analytics reports. This is likely because Google Analytics has different methods for counting and delivering data.
- The majority of user continues to visit the Knowledge Base via desktop and is -1.3% less than last quarter, but the number of users via mobile increased +1.2% compared to the previous quarter.
7 Day Active Users
This Google Analytics resource was unavailable. This could be a result of sunsetting Universal GA and moving to GA4.
Site Load Time
The site load time, as well as the best and worst performing browsers, includes:
- Average load time: .70 seconds
- Best-performing browser: Edge .54 seconds (26,131 page views)
- Most popular browser: Chrome .65 seconds (59,604 page views)
- Worst-performing browser: Android Webview 8.87 seconds and Safari 3.68 seconds
Top 10 Landing Pages
Depending how a user lands on the Knowledge Base, we want to understand the top landing pages as well as subsequent actions they took on the site. As we look at the user journey and behavior flows, we recognize that the homepage is by far the top landing page and people continually return to it throughout their user experience.
The homepage is the most popular landing page on the Knowledge Base with 5.8K sessions. From the homepage, the top three first interactions that users made include visiting these pages:
After the homepage, the top 10 most popular landing pages include the following list (based on sessions):
- Accounts 4K sessions
- Banno People 2K sessions
- Transaction enrichment 1.9K sessions
- Support Inbox 1.5K sessions
- App Overview 1.1K sessions
- Support 1.1K sessions
- Banno People Authentication/ 926 sessions
- Product Collateral 825 sessions
- Enterprise Users 716 sessions
- CMS 672 sessions
- Our homepage does well driving traffic in to the Knowledge Base, and it appears people use the home page to drive themselves back in to the site.
Top 15 Visited Pages
After the homepage (13,137 pageviews), the top 15 most popular pages include the following:
- Accounts 7,242 pageviews
- Banno People 4,354 pageviews
- App Overview 3,845 pageviews
- App Authentication 3,015 pageviews
- Banno People Authentication 2,744 pageviews
- Transaction Enrichment 2,738 pageviews
- Banno Support Inbox 2,628 pageviews
- Banno Support Overview 2,500 pageviews
- Banno People Users 1,840 pageviews
- Product Collateral 1,816 pageviews
- Enterprise Users 1,797 pageviews
- Banno People Settings 1,699 pageviews
- Banno CMS 1,658 pageviews
- Banno Reports 1,445 pageviews
- Settings (Users & Groups) 1,337 pageviews
How many users have visited the site?
Since using Google Analytics starting in August 2020 through March 31, 2023, we’ve had 81,449 new users visit the Knowledge Base and 532,807 pageviews.