After an unusual busy first quarter, traffic levels out in Q2. Traffic to the Knowledge Base is still up compared to this time last year, but down compared to last quarter’s high amount of users. While we published a few net new docs, nothing affected all Banno institutions this quarter like it did in Q1.
Customer-facing net new docs for Q2 include:
- Permissions segments (272 pageviews)
- Prepare credit union for Business ACH (49 pageviews)
- Business ACH companies for credit unions (43 pageviews)
- Business ACH management for credit unions (54 pageviews)
- Spanish support (27 pageviews)
- Positive pay for banks (32 pageviews)
Total pageviews for net new docs continued from Q1 include:
- Transaction enrichment (3,015 pageviews)
- Sign in with passkey (745 pageviews)
- Link an account from another institution (847 pageviews); published end of Q1 and the Statement was emailed the day before Q2 began
Let the doc team know if you have feedback, questions, or want additional info in future updates.
Audience/User Overview
Total Traffic
In figure 1, traffic to the site is up 51.3% from last year’s Q1.
Figure 1 | Number of users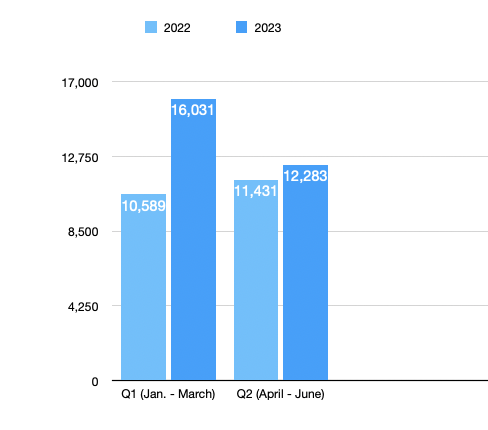
It’s important to note that analytics for Q2 do not include the last two days of June (Thursday, June 29 and Friday, June 30). With Universal Analytics permanently sunsetting on July 1 and moving to GA4, GA is not giving us the data for those two days in June. Typically, we would see 300+ users on a day, but the data isn’t included in this report. Although Q2 user numbers should be slightly higher, here is an overall comparison for the number of users and their engagement this quarter:
| '23 second quarter | Compared to '23 first quarter (last quarter) | Compared to '22 second quarter | |
| Users | 12,283 | −23.3% (16,031) | +7.4% (11,431) |
| New users | 9,596 | −29.7% (13,655) | +4.9% (9,147) |
| Sessions | 26,930 | −15.7% (31,948) | +26.3% (21,319) |
| Pageviews | 74,560 | −15.2% (87,927) | +18.1% (63,085) |
| Pages per session | 2.77 | +0.7% (2.75) | +6.4% (2.96) |
| Average users per month | 4,866 | −21.4% (6,195) | +9.7% (4,434) |
| Most visited day | 441 users | −17.8% (537) | -50.2% (887) |
Additional analytics to be aware of include the following:
- Average session duration: 2 minutes 35 seconds
- Most visited week:
- 1,592 users between June 4 - June 10
- 1,576 users between April 30 - May 6
- Compared to last quarter, the most visited week was 19% lower. Last quarter was an atypical month with a couple of releases that impacted all institutions. 1,500 users in a week is pretty average. It’s slightly higher than normal likely due to the May Statement published on June 1.
- Most visited day: There were 441 users on Monday, May 1. On Friday, April 28, the April Statement was published, and customers likely read the Statement and clicked doc links on Monday, May 1 when they were back in the branch.
- Published the customer-facing Link an account doc on March 23. The doc had 31 pageviews within three days of publishing, but the March Statement was emailed Friday, March 31 and linked to the doc. In Q2, the doc garnered 749 pageviews. This doc on third-party account connection was highly anticipated by Banno customers who contract Geezeo PFM functionality.
Visitor Acquisition Types
The vast majority of visitors accessed the site through direct traffic. The following chart details the traffic sources for the site during the fourth quarter:
Figure 2 | Number of users by acquisition type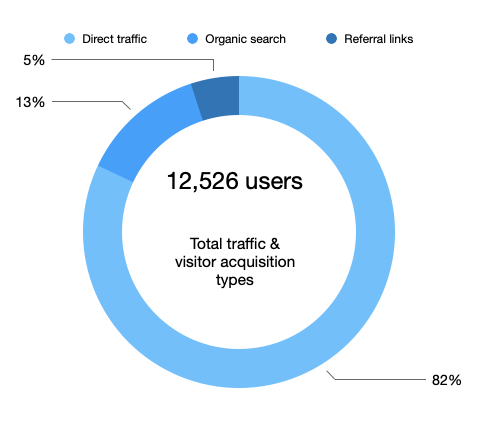
Descriptions for each acquisition type shown in Figure 2 include:
- 12,526 users
- Direct traffic: 10,297 users typed the website address into the URI bar or clicked on a link to the Knowledge Base.
- Organic search: 1,595 users accessed the website via our links in search results.
- Referral links: 633 users accessed the website via another source (often non-Google ads).
- Social : 1 user accessed the website via a link on social media (Facebook).
Observations
- The number of users displayed (12,526 users) is more than the 12,283 users that Google analytics reports. This is likely because Google Analytics has different methods for counting and delivering data.
Device Type
Figure 3 shows that the majority of users accessed the site via desktop:
Figure 3 | Device used to access the site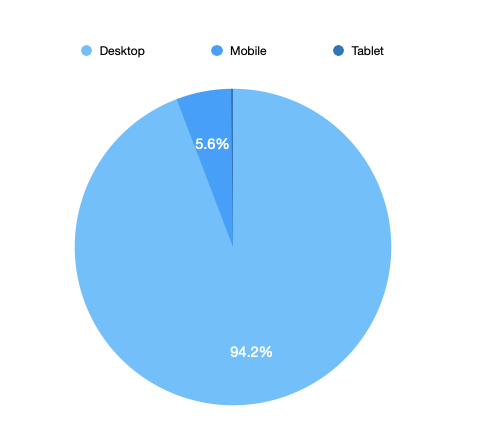
The breakdown of the 12,225 users using a specific device includes:
- 11,522 users via desktop
- 678 users via mobile
- 25 users by tablet (.2%)
Observations
- The number of users displayed (12,225 users) is less than the 12,283 users that Google analytics reports. This is likely because Google Analytics has different methods for counting and delivering data.
- The majority of user continues to visit the Knowledge Base via desktop and is -.6% less than last quarter, but the number of users via mobile increased +.6% compared to the previous quarter.
7 Day Active Users
This Google Analytics resource was unavailable. This could be a result of sunsetting Universal GA and moving to GA4.
Site Load Time
The site load time, as well as the best and worst performing browsers, includes:
- Average load time: 1.70 seconds
- Best-performing browser: Edge .97 seconds (23,520 page views)
- Most popular browser: Chrome 1.12 seconds (49,155 page views)
- Worst-performing browser: Amazon Silk 1.76 seconds
Despite less traffic, site load time is up compared to last quarter.
Top 10 Landing Pages
Depending how a user lands on the Knowledge Base, we want to understand the top landing pages as well as subsequent actions they took on the site. As we look at the user journey and behavior flows, we recognize that the homepage is by far the top landing page and people continually return to it throughout their user experience.
The homepage is the most popular landing page on the Knowledge Base with 5.6K sessions. From the homepage, the top three first interactions that users made include visiting these pages:
After the homepage, the top 10 most popular landing pages include the following list (based on sessions):
- Accounts 3.6K sessions
- Banno People 1.7K sessions
- Product Collateral 1.3K sessions
- Support Inbox 1.3K sessions
- Support 996 sessions
- App Overview 834 sessions
- Banno People Authentication/ 768 sessions
- Enterprise Users 557 sessions
- App Authentication and Security 552 sessions
- Banno Content Training Videos 514 sessions
- Our homepage does well driving traffic in to the Knowledge Base, and it appears people use the home page to drive themselves back in to the site.
Top 15 Visited Pages
After the homepage (11,779 pageviews), the top 15 most popular pages include the following:
- Accounts 5,928 pageviews
- Banno People 3,619 pageviews
- App Overview 3,014 pageviews
- Product Collateral 2,445 pageviews
- App Authentication 2,375 pageviews
- Banno Support Inbox 2,206 pageviews
- Banno People Authentication 2,130 pageviews
- Banno Support Overview 2,079 pageviews
- Enterprise Users 1,531 pageviews
- Banno Reports 1,486 pageviews
- Banno People Users 1,476 pageviews
- Banno Business 1,438 pageviews
- Banno People Settings 1,414 pageviews
- Banno CMS 1,372 pageviews
- Settings (Users & Groups) 1,089 pageviews
For the first time, the Banno Business landing page is one of the top 15 visited pages. The Product Collateral landing page climbed from tenth to the fourth most popular page on the Knowledge Base.
How many users have visited the site?
Since using Google Analytics starting in August 2020 through June 28, 2023, we’ve had 91,045 new users visit the Knowledge Base and 607,367 pageviews.
Since using Google Analytics starting in August 2020 through June 30, 2023, we’ve had 91,333 new users visit the Knowledge Base and 609,516 pageviews. On the eve before Universal Analytics was sunset on Saturday, July 1, data from June 29 and June 30 began displaying. Because of time constraints, the data above is based on April 1-June 28.