Logging 101
Each of our applications produces logs from some logging library. In Scala that may be log4s or log4cats. In Node and Go it’s something else that I, your narrator, don’t know the name of. Each of these logging libraries has the ability to log each message to a certain level. What are those levels? Take a look here. Back to our applications, when your application logs to a certain level denoted by the method you call the library determines if it gets actually put out into the world (stdout) to be picked up. Something like a logback file allows for us to tell the application to only ouput into stdout the logs of a certain level and higher. For example, in production you probably don’t want the trace logs which are really noisy, so you may set it up to only output debug.
That means that only debug, info, warn, error, and fatal will be put out into stdout.
How do the logs go from stdout to Datadog?
Each of the mesos or k8s nodes runs a datadog-agent which reads from stdout of your container and sends them to Datadog. Anything we send to Datadog from the datadog-agent or their api is called “ingest”. Think about ingest as anything that crosses into their network space. The datadog-agent does have a few quirks though, it batches 4 log messages at a time to send to Datadog, but has a 1MB limit. That means that each log can only be 256KB in size otherwise it will truncate each to the 256KB each.
What does that mean for you? Large logs, like lots of xml from third party applications, don’t actually end up getting into datadog. There are ways around this, such as breaking up logs into smaller chunks and sending them that way, but that’s not the purpose of this post.
Datadog Flow
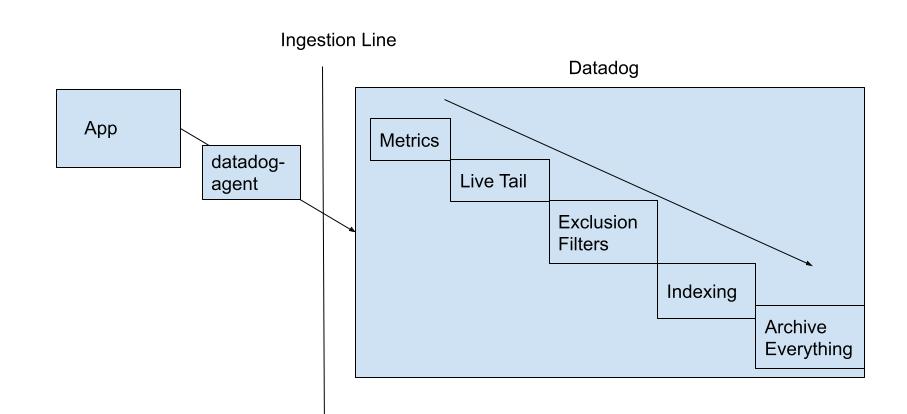
Alright, our logs are getting sent to Datadog, now what? As logs flow into Datadog the size of each log is added to an ingest counter, more on that later. Once the log comes in it goes through a few steps, first it goes through the Live Tail where you can wave to your log as it bolts through the network. Next, it hits the Metrics area. If you currently have a metric up to maybe count a certain log etc it will do that. After that is complete the log is then at the point of our exclusion filters.
An exclusion filter is the same as what you use for querying your logs, but whatever is found for that query it will not index, which means that it won’t be searchable. All logs that aren’t part of the myriad of exclusion filters that we have setup here will then proceed to be indexed. Note: These can be turned on or off via toggles in case we need to include something during an incident, but this only affects those logs coming in right then and onward. These logs are all indexed on a single “index” in datadog where each log will be kept searchable for 15 days. Indexes can have their own amount of time they keep logs for as well as their own exclusion filters, but we currently only have one that everything is indexed on. To look at how these filters could be setup Datadog has a video here.
Finally, all of our logs, both indexed and not indexed, go to the Archive. Currently we’re split on environment which you can see here. These are actually just buckets / azure blob storage, which we own and pay for outside of Datadog, to store all of our logs that we’ve sent to datadog. They also serve another purpose: they’re where we can pull logs back out for rehydration.
This diagram shows the flow of things as well.
Rehydration
Much like the old days of ELK stack, logs rotate out of our indexed logs and we need to go look at something that happened when Turing was alive. Necromancy is usually frowned upon, but bringing logs back from the dead is sometimes a necessity. Rehydration happens from here. Here you’re asked to choose which Archive to find the logs in and then run a query on to decide which things to index. You’re also asked for a date range to look at. We’re charged ingest rates for any logs it has to look through. This means that you should try to look through the smallest range. Note, your scan size for ingestion is determined purely on the date range chosen for that archive. If 100 logs exist for all of our apps from 11:00AM to 11:01AM then all 100 logs will be ingested, charged, and then the filter will apply to see what’s going to be indexed. In addition to ingestion rates we’re also charged per million events we index. We’ll get to this pricing next.
Pricing and Examples
Currently we pay for a single index that has a 15 day retention span. Think of an index as a set of exclusion filters and amount of days that we retain the logs indexed for. Every GB of data that flows through Datadog costs us $0.10. For example if you have 1 TB of data coming in from applications that’s 1024 GB of data which costs us $102.40 just to send to Datadog. Next the exclusion filters happen, let’s say that takes out about half and you have 500 GB of data that needs indexed which is let’s say 10,000,000 logs. Per million logs we’re currently charged about $1 per million. So this ingestion and indexing would be calculated as:
1TB of Data Ingestion + 10 million logs indexed = Price $102.40 + $10 = $112.40
How can we use exclusion filters to help with our spend?
We probably don’t look at 99% of our logs. Not indexing logs is common for doing things like sampling logs (exclusion filters of 98% on some facet) or just removing noise without removing it from the service as a whole. If needed we can rehydrate the log later into our index. Excluding logs from indexing reduces our spend on our index costs, but allows us to bring them back to be searchable if we need to later on.
Notes on Rehydration Pricing
As stated before, whatever time range you are rehydrating is considered an ingestion price. You can see how much data is being ingested from the Archive Scan Size Estimate link when creating a rehydration / historical view. A reminder on pricing, we’ll pay 10 cents per GB it looks through and then $1 per million log events that it indexes. Keeping your date range smaller helps keep the cost on this low along with making sure your index query is specific as to what you’re looking for. Don’t reindex the world when you need only a single applications log for a specific request id. If you’re being asked to scan through a large portion of things for a customer issue it doesn’t hurt to clarify with Chad or Abby if it’s worth the price as well.
Notes on Archive Splitting
To reduce the size of logs we need to look through when rehydrating logs, we’re looking at splitting our archives into smaller buckets based on some criteria. This would reduce the amount of logs you’d be searching through at any point in time.
Logging Footprint
To keep track of how much each of our applications ingest and index there’s this nifty dashboard. Play around with the dashboard and see what services are ingesting and logging the most.
Maybe you’re looking at your service specifically though. In that case a good way to see what you’re logging the most (and indexing) is through the pattern ability of Datadog. For example, here is Che’s pattern / logs.
After looking at the above dashboards what can you do?
You’re now able to calculate how much you spend and even lower that spend by removing logs that aren’t useful, combining logs, filtering out logs with exclusion filters, and changing your log level. If you see something that isn’t useful to be indexed, or even ingested, clean it up with filters or just in the code itself.