Firefighter Duties
The Prism team has a weekly firefighter rotation. The firefighter is the first line of defense for any incidents or issues impacting Prism services.
During the rotation, the firefighter is expected to:
Primary FF
Duties
- Process customer issues ([steps])(#process-customer-issues).
- Watch for service issues or degradation after production deploys.
- Prefer using the Deployment Monitoring Dashboard
- Other useful links:
- Deploy node-consumer-login-proxy Tuesday and Thursday.
- Handle errors logged to
#auto-prism. - Keep an eye on the
#team-prism-ffand#org-reliability-ffchannels for any urgent concerns. - Handle incident.io alerts 24/7. Alerts should be acknowledged once received, and resolved once the issue is resolved.
- Create/manage fixes for the aforementioned issues, or ask others to help fix an issue.
- On Mondays update
#org-prismand#team-prism-privatechannel topics to reflect who is currently on call. - Silence alerts when there is Banno-affecting maintenance.
- Maintenance items for the week are posted every Monday in
#org-reliability-ff, which detail what Banno/Digital products are affected. The infra teams will also silence alertmanager during maintenance windows if they expect that alerts would be triggered. - Check the (non-Digital) JH maintenance calendar for events that may require silencing:
- OutLink maintenance window
- See Mark’s video tutorial on how to silence Prometheus alerts (alertmanager).
- Maintenance items for the week are posted every Monday in
- On Fridays hand-over a summary of
OPSticks on#team-prism-fffor the nextffto take over on Monday.
Process Customer Issue Steps
- Use JIRA to see issues that need to be triaged.
- active OPS tickets assigned to Prism
- actionable OPS tickets (not waiting for OPS review)
- Go through each issue one by one, analyzing the description at a high level
- For each issue that is determined to be outside our domain, follow these steps:
- Click
Automation - Tier-2 Triage V2 - Reject Issue - Prism - Click
Run
- Click
- For each issue that needs to be fixed by
Prism, follow these steps:- Click
Automation -> Tier-2 Triage V2 - Claim for Prism - Click
Run - Note: When we do this, a NODE-XXXX ticket is created for us and linked to the
OPSrelated ticket - For each ticket created via automation, we need to manually make these changes:
- Assign to yourself
- Assign the Ongoing Customer Issues Epic
- Click
- During investigation, if you find a service in the logs that you are not familiar with, you can identify the owner here. If you need help or clarification, you can reach out to that teams slack channel
- Provide regular updates on the ticket until it’s complete.
Secondary FF
Duties
- Perform services scaling
- Archive unused feature flags (steps)
- Check for schema validation failures (steps)
- Run standups
- Work on GitHub security findings
The firefighter should pull in other team members and co-workers as needed to resolve an issue. All team members should generally be reachable through Slack DM and SMS and phone call, except when on PTO.
Check for Schema Validation Failures Steps
We validate many of our service inputs using Zod validation. When validation errors occur we do not crash. Instead, we log the errors so we can address them w/o taking our systems down.
Once each week we need to run this HC query and create a JIRA ticket for any existing schema validation errors, so they get addressed quickly.
Archive Unused Feature Flags Steps
Either observe the Launch Darkly Dashboard or run this HC query to get an idea of what feature flags are running in our services.
On the Dashboard, sort the flags by Created oldest. Note any flags greater than 3 months. Use the previous HC query to see if the flag is still being used in a live environment.
If it is not in use:
- Check the flag description on the Launch Darkly Dashboard for a Jira Ticket
- The ticket should contain information regarding removal prerequisites
- Determine if the flag is ready for removal
- If it appears to be ready for archiving, reach out to the maintaner of the flag for confirmation
- Archive in lower environments first, observe logs and confirm behavior is correct
- Finally, archive in production and observe logs to confirm behavior
Github Security Findings and Kenna Vulnerabilities Steps
Each week we need to work on security findings. This is the job of the secondary firefighter.
- Choose a security alert to work on from the Jira issues.
- The epics are broken out by month; look for the next issue that is due.
- Look for an unassigned, unresolved issue.
- If we are caught up chronologically (no issues due in the next month), you can also consider tasks in the “Low priority” epic.
- Assign yourself to the issue and work on resolving it.
- Most of the issues are fixed through dependency updates. Sometimes Dependabot has already created, or can create, a PR to do that.
- If you’re unsure of how to resolve the issue or have any questions, reach out to the team.
- Once the fix has been merged, confirm that Github closed the underlying security alert.
- Make sure that the fix is disseminated to users.
- Libraries should have a new release published.
- Services should have the fix deployed to production.
Get Firefighter Access
- Getting FF access is done using the Firechief in Backstage. Just click the
REQUEST ACCESS FOR <your user>button. - If you get an automated error like
John Doe is not a banno user, you need to update your Slack account email to match your People email (most likely your @jackhenry.com email).
Incident.io Account Setup
All team members (that have Active Directory accounts) can use incident.io. Login to incident.io using your email address and your Okta credentials to set up your account.
You must download and install the incident.io app to receive pages to your phone or other devices. Be sure to configure your phone to allow notifications from incident.io while your phone is in Do Not Disturb mode.
You can configure your on-call notification alerts through the incident.io website. To set your notification rules, click on your name in the bottom-left corner and choose Preferences. You can set your preferred contact methods for voice calls, SMS, email, Slack, and push.
It is recommended to take care when selecting your notification rules. A good practice would be to establish both a primary and secondary means of notification in case one becomes unavailable for a period of time. For example, it’s probably best to not choose two notification methods that require internet access, but instead maybe one that requires internet and another that alerts your phone directly.
Then add yourself to the Primary schedule and Secondary schedule.
If you wish, you can add the firefighter schedules to Google Calendar. On the incident.io schedule page, click on the “⋮” button on the schedule page and choose “Sync to calendar”.
Handling Incidents
Incidents are urgent issues impacting customers. The general rule of thumb is if you feel any concern or doubt about a service causing customer impact, spin up an incident and if it turns out to be a non-issue, we can stand down.
Creating Incident
Incidents are created by associates by running the /inc opencommand in Slack. Please use /inc help in Slack to review the documentation.
The /inc open command will open a prompt. Write a summary and assign a severity. If you know the service or team that needs to be paged, fill in the “Backstage Component” or the “Escalation Path” fields.
Paging
You can use the /inc escalate Slack command to page a team or person without creating an incident.
Handling A Page
Pages happen when an alert triggers or an associate notices issues related to a service. Only critical or major/high severity alerts will page the firefighters. Alerts (of all severities) will also be posted in the #team-prism-ff channel.
Once a page happens, it will notify the primary FF and EM through incident.io. If not acknowledged within 30 minutes, the alert will be escalated to the rest of the firefighters.
You can acknowledge a page directly from the alert, or through the incident.io portal. You will then need to work on getting the incident resolved with others. Once done, mark the incident as resolved through incident.io (otherwise you will continue to get notified).
First Steps
Even though the Prism team offers some services, much of what is handled by us is a proxy to other services usually provided by the Scala teams. Therefore, before it is assumed to be a service that Prism provides, some initial checks should be considered.
- Determine which stage the errors are occurring (Development, Staging, Production)
- Check the appropriate Prism Grafana graphs for the current CPU and memory usage.
- Currently, the server resources provided for our team may not be enough in some circumstances to properly handle request loads.
- If it’s found to be a resources problem, you can modify the service’s app overrides in banno/environments to scale out the
cpus,memand/orinstances. (Note: Because Node.js is single-threaded, the maxcpusvalue is1.0.) The infrastructure team can help deploy the change quickly.
- Check the appropriate Prism Grafana for errors.
- These errors can give us an idea of which node application is firing off these errors.
- Check Honeycomb for the appropriate error message that was being given (e.g. GatewayAuthError) or the status code (e.g 500) that was firing off.
- Doing this can help the underlying service code owners to determine which path/app is messing up and how to fix it.
- If it’s not the fault of a Prism service, it can be handed off to the appropriate team(s).
If any of these solve the problem, take a second to breathe; you just fought* the fire. 👩🚒🔥👨🚒
*** Not really. You passed it off to someone else, but you know, don’t stop celebrating the little things. 🎉
Second Steps
If it turns out that none of the First Steps solves the issue, then it’s definitely our fire to fight. Even if doing the steps above seem tedious, they are helpful for determining which one of our applications is causing the error and possibly why.
Consider if a deploy went out for the affected service shortly before the incident started. That could help point to the underlying cause, and provide a quick way to fix the problem (via rollback) until a more permanent fix is ready.
If the specific error message is not known, one can use
data.statusCodeorcodeto search for a specific HTTP status code (4xx, 5xx), orseverityto show only errors. Examples of how to search for those can be found belowOnce you have found the request ID, you can do a simple search in Honeycomb such as this
x_request_id = <request ID>. For example, a request ID of6979871aa5454417bdf39f433efc1b0ccan be searched by replacing<request ID>with the number:banno.request.x_request_id = 6979871aa5454417bdf39f433efc1b0c. This query should return the logged requests with that ID to help determine information about the issue and why it may be happening and to be able to easily share the log(s) with others.You can find the full trace by searching for the request ID with
x-request-id = <request ID>or querying the correlation ID withcorrelationId = <correlation ID>.Once you have the Prism service and route causing the incident:
- check if any feature flags are related to this repository or route
- Visit the Production Launch Darkly Dashboard and note the descriptions of each flag. There should be the service and effected routes the feature flag is used in. Use the filter to search for all the flags related to a repo (ex.
node-consumer-login-proxy) or route (ex./v1/users/:userId/dashboard).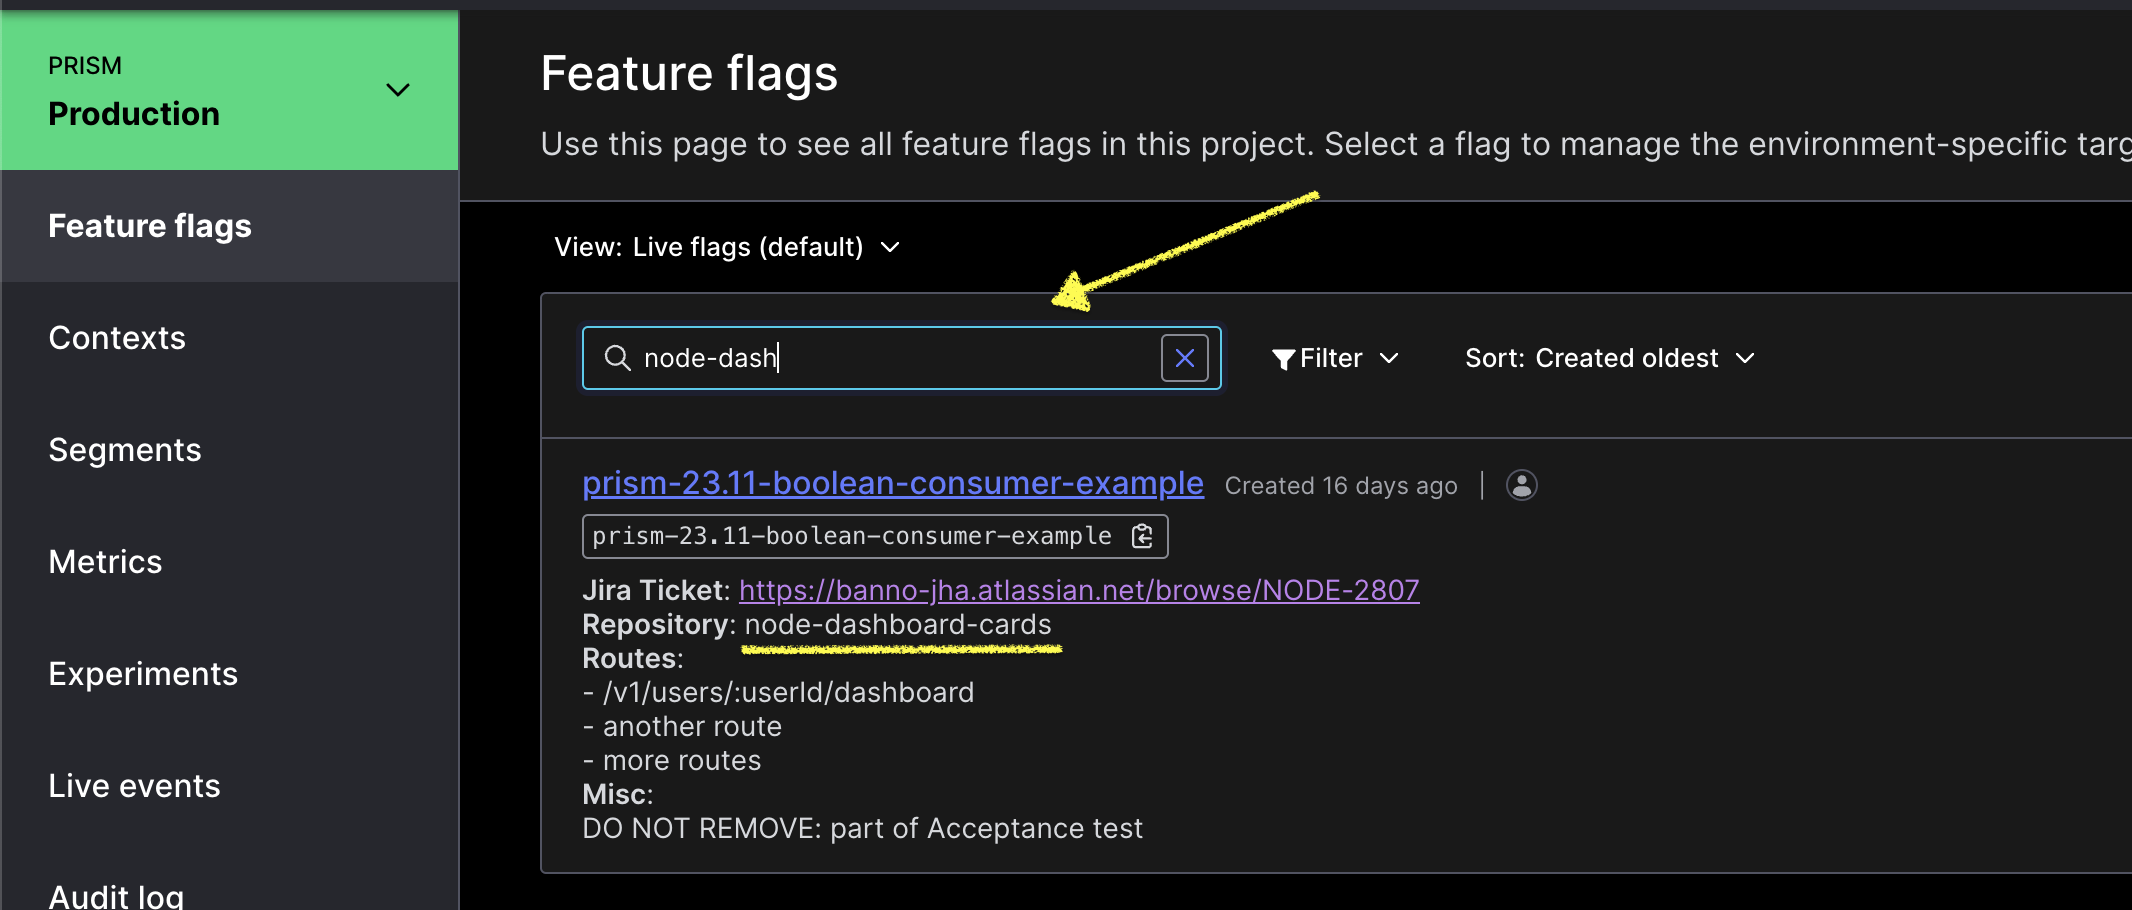
- If there is a feature flag associated with the service and route, more research is warranted. If not, a feature flag most likely won’t help
- In the feature flag description there should be a Jira Ticket with information regarding the feature flag and its usage/intentions
- If there is not a Jira Ticket, search the source code in the Team-Prism Repo for that flag name and determine if toggling that feature flag could resolve the issue.
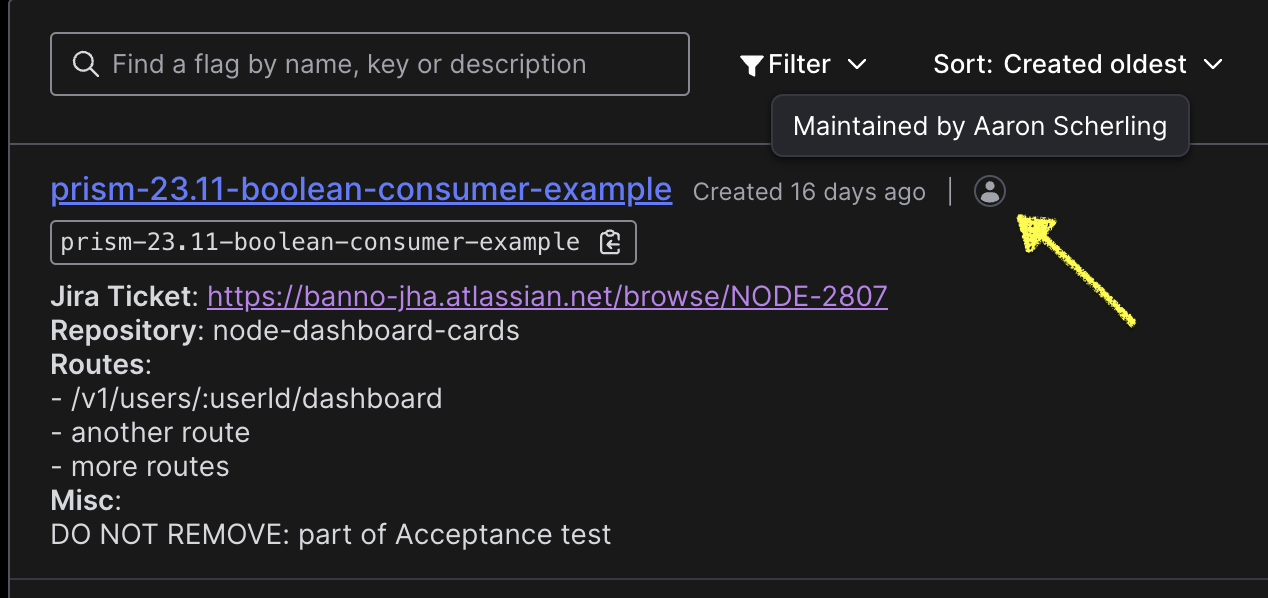
- Reach out the maintainer of the flag if more context is required. Find the maintainer in the Launch Darkly Dashboard -
- When the feature flag is used within a
featureFlagWrapperfunction,funcAwould be the off behavior andfuncBis the on behavior.
Data Services Query Tool
The Data Services Query Tool is available for retrieving information on Tasks, Details, Users and Institutions. Example uses include:
- Get userId by NettellerId
- Get Details by InstitutionId
- Get Tasks by userId/taskId within a given time range
Helpful Logging Searches
service.name = <service-name> code = <status code>code = <status code>service.name = <service-name> data.statusCode = <status code>service.name = <service-name> code = <status code>service.name = <service-name> body = "<Error message>"banno.request.x_request_id = <request ID>
Post Incident
The incident.io Slack bot can be used to capture the incident timeline and follow-ups during the incident. You can also go to the Post-Incident section of the incident page after the incident is resolved.
The incident analysis is expected to be done in 48 hours after the incident has been resolved. This is to try and capture as much as possible while it’s fresh in your mind.
The root cause analysis is expected to be done in 2 week after the incident has been resolved. This should provide a bit more detail into the issue and a deeper understanding of the issue as a whole.
For more information, see Banno’s incident response process for details.
See our runbook for creating a hotfix for a service.
Alerts
Alerts configured in alertmanager (sourced from Prometheus metrics), Datadog, Honeycomb, or other sources must also be configured to send incident.io alerts, if appropriate. This usually requires:
- Adding an incident.io hook to the alert
- Tagging the alert with our team name (
jha-psa-backstage-digital-prism)
Prometheus Alertmanager
The Prometheus alertmanager can be found in the #auto-prism slack channel. The webhook posts inside of the channel when specific conditions are met (for more details, see this file). The different messages will be based on the rules and conditions. As of now, prometheus will post a message in the slack channel if there are more than 5% of requests failing.
Posts from Prometheous will look similar to this:
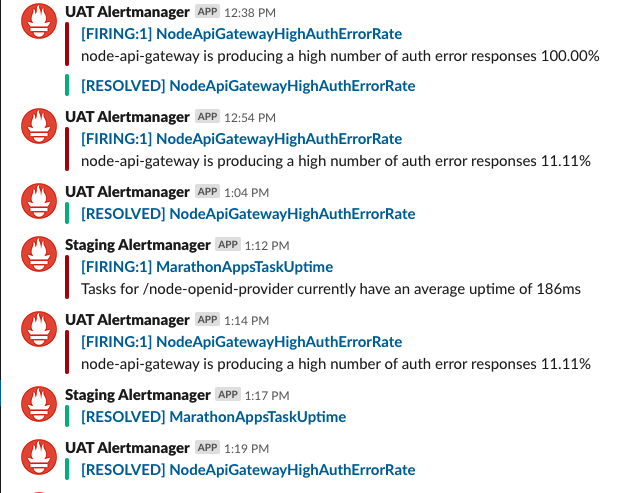
Prometheus gives both the application/service that is making the rule fire off as well as the specific rule that is firing. In the example, NodeApiGatewayHighAuthRate can be searched in Honeycomb as body = GatewayAuthError. Therefore, it allows us to skip a few steps when determining the cause of failure.
Aside from telling us the error information, the name of the Prometheus webhook when posting is also which environment the error is occurring in: Staging, User Acceptance Testing (UAT), or Production.
Knowing this ensures that we are looking at the correct grafana graphs and logs when determining the error’s request ID.
As a disclaimer, even though Prometheus has its uses for failing services, there will be times that it won’t be useful for every incident, so don’t rely on Prometheus to provide information or even be firing off if specific services aren’t working properly.
Other runbooks
Other incident/firefighting runbooks that have been created:
- node-api incident runbook
- node-openid-provider research customer issues
- Banno’s general incident handling response documentation
Rotation
Firefighter rotation is almost automatic:
- The schedules automatically rotate the firefighter every Monday.
- The
/oncallSlack list is automatically updated. - Team members must update the
#org-prismand#team-prism-privatechannel descriptions to display the current firefighters. - Team members must manually add or remove themselves from the Jira FF team at the start of each rotation.
If you take PTO during your rotation, find another person to cover for you and add an override to incident.io. The incident.io portal has an easy method to request coverage from your fellow firefighters.
Help
Your teammates are available if you need help. However, there are a lot of services that this team is responsible for so it’s easy to forget where to start sometimes. The Prism firefighting runbook is a great resource to help in troubleshooting an issue.