Table of contents
- Firefighter Duties
- Guides
- Get Platform Firefighter Access
- Incident.io onboarding
- Handling Incidents
- Prometheus Alertmanager
- Rotation
Firefighter Duties
The team has a weekly firefighter rotation. The firefighter is the first line of defense for any incidents or issues impacting Terminus services.
During the rotation, the firefighter is expected to:
Handle Deployments
- Deploy node-api-gateway Monday, Tuesday, Wednesday, and Thursday. That schedule generally follows the Terminus release process.
NOTE: Temporarily make sure that any changes in
node-api-gateway-baseare also put intonode-api-gatewaywhen doing a release. - Deploy satellite-node-api-gateway if there are core changes, at least monthly. Endpoint definitions don’t need satellite deploys, but changes to the underlying proxy should be deployed regularly to prevent satellite from lagging too far behind. Satellite release process.
Monitor Resources
- Watch for service issues or degradation after production deploys.
- Satellite NAG in Origin metrics:
- GCP Dashboard - Origin Satellite-NAG metrics - click
satellite-node-api-gatewayto see graphs of CPU, Mem, etc. - Honeycomb Dashboard - Origin Satellite-NAG requests
- Honeycomb Query - Origin Satellite-NAG 500s
- GCP Dashboard - Origin Satellite-NAG metrics - click
Incident/Question Response
- Process customer issues guide.
- Monitor
#org-terminus-nagand#org-terminus-nag-prfor any questions or PRs. - Monitor
#team-terminus-ff, and#org-reliability-ffchannels for any urgent concerns. - Create/manage fixes for the aforementioned issues, or ask others to help fix an issue.
- Handle incident.io alerts 24/7. Alerts should be acknowledged once received and resolved once the issue is resolved. The primary FF is expected to always handle incidents. If the primary FF will be unavailable for a block of time, they must ask in Slack if someone else can cover their shift during that block of time.
Misc
- Check for schema validation failures guide.
- Review GitHub security findings and make sure a Jira ticket exists based on the SLA guide.
- Review NAG log usage and trim unnecessary logs with this HC query.
- Ensure the Node.js Docker images build action is running without errors.
- Perform services scaling using the Terminus spreadsheet.
The firefighter should pull in other team members and co-workers as needed to resolve an issue. All team members should generally be reachable through Slack DM and SMS and phone call, except when on PTO.
Guides
Process Customer Issues Guide
- Use the Customer Support Tickets - Terminus filter in Jira to see issues that need to be triaged.
- Go through each issue one by one, analyzing the description at a high level.
- For each issue that is determined to be outside our domain, follow these steps:
- Click
Automation - Tier-2 Triage V2 - Reject Issue - Terminus - Click
Run - If an issue is outside of our domain but requires follow-up, then manually create a Terminus Jira issue outside of the automation, link it to the OPS issue, and assign it to yourself to help track the OPS issue until it is finished.
- Click
- For each issue that needs to be fixed by
Terminus, follow these steps:- Click
Automation -> Tier-2 Triage V2 - Claim for Terminus - Click
Run - Note: When we do this, a NAG-XXXX ticket is created for us and linked to the
OPSrelated ticket - For each ticket created via automation, assign yourself
- Click
- During investigation, if you find a service in the logs that you are not familiar with, you can identify the owner in the Domain Ownership Doc. If you need help or clarification, you can reach out to that team’s Slack channel.
- Provide regular updates on the ticket until it’s complete.
Check for Schema Validation Failures Guide
We validate many of our service inputs using Zod validation. When validation errors occur we do not crash. Instead, we log the errors in Honeycomb so we can address them without taking our systems down.
Once each week we need to run this Honeycomb query and create a Jira ticket for any existing schema validation errors so they get addressed quickly.
GitHub Security Findings and Kenna Vulnerabilities Guide
Each week we need to work on security findings.
Look through each of our repositories: team-terminus repositories on GitHub.
If there are any repositories that have issues or alerts listed next to the Security link, then they will have either Dependabot, Code Scanning, or Secret Scanning alerts that need to be fixed. Create a Jira issue to track fixing any alerts for these repositories.
- Assign yourself to the issue and work on resolving it.
- Most of the issues are fixed through dependency updates. Sometimes Dependabot has already created, or can create, a PR to do that.
- If you see a Dependabot PR, ensure that it updates both the package.json and the lockfile. Otherwise, updating will have to be done manually. If you do update the issue manually, make sure to close out the Dependabot PR if it does not automatically close. If you do not, you will eventually get a message that Dependabot will stop warning about security issues.
- In repos that use pnpm, you can try updating by running
pnpm auditto see any security vulnerabilities andpnpm updateto automatically update. - Ensure that major versions are not being upgraded. Semver
^should allow only minor and patch versions, but just double-check in case package.json was not specified correctly.
- If you’re unsure of how to resolve the issue or have any questions, reach out to the team.
- Once the fix has been merged, confirm that GitHub closed the underlying security alert.
- Most of the issues are fixed through dependency updates. Sometimes Dependabot has already created, or can create, a PR to do that.
- Make sure that the fix is disseminated to users.
- If there are any Dependabot or Code Scanning issues, make sure to address them.
- If they are for credentials in e2e tests, please dismiss them and make sure to put in a comment when you do.
- Libraries should have a new release published.
- Services should have the fix deployed to production.
There are often transitive dependency cases like our package A depends on B, which in turn depends on C and there’s a security vulnerability in C v1.0.0 that has been fixed in v1.0.1 but the latest version of B still depends on C v1.0.0. In that case you can add a pnpm override in A’s package.json like this:
"pnpm": {
  "overrides": {
    "C": "^1.0.1"
  }
}
Then rm -r node_modules/ pnpm-lock.yaml and pnpm install to regenerate the lock file.
Sometimes installing recently patched dependencies (e.g. package C) will fail with something like:
ERR_PNPM_NO_MATURE_MATCHING_VERSION No matching version found for C@1.0.1 ...
even though that version does exist. This is because we define minimumReleaseAge: 14160 in pnpm-workspace.yaml in order to avoid installing packages with zero-day vulnerabilities. However, in this case we do want to install the latest version of the package because it includes a security patch. Following our example, we’d add this to pnpm-workspace.yaml temporarily:
minimumReleaseAgeExclude:
  - "C"
then pnpm install and remove that exclude of C from the workspace file before committing the changes; pnpm won’t complain about the missing version again once it has been successfully installed and the lock file is generated.
Get Platform Firefighter Access
This refers to gaining temporary admin privileges for accessing institutions in our back-office admin site, to investigate issues with live institutions. This is not needed for accessing Honeycomb or Grafana in production.
Getting FF access is done through the FireChief website.
Incident.io onboarding
See the Incident.io onboarding (Google Doc).
Use /inc help in Slack to review the documentation and complete the tutorial.
Handling Incidents
Incidents are urgent issues impacting customers. The general rule of thumb is: if you feel any concern or doubt about a service causing customer impact, spin up an incident; if it turns out to be a non-issue, we can stand down.
Creating an Incident
Incidents are created by associates by running the /inc command in Slack.
Paging
Paging is used to get immediate attention from teams in Banno by running the /inc page command in Slack.
This will open a prompt to clarify what the page is for by asking these questions:
- Escalation Path: team name to page
- Notification message: the reason why you’re paging them
The team paged will look for the cause of the page and ongoing conversations related to the page. Pages usually come after an incident has started which makes tracking down the conversations easy for the person paged.
Handling a page
Pages happen when an automation or an associate notices issues related to a service. Once a page happens, it will notify the primary FF through incident.io. If the primary FF does not acknowledge the page within 30 minutes of the initial page, it will then notify the secondary FF.
The primary FF is expected to always handle pages. If the primary FF will be unavailable for a block of time, they must ask in Slack if someone else can cover their shift during that block of time.
The secondary FF does not exist for casually escalating pages, they only exist as a last resort for rare circumstances, e.g. if the primary FF loses both cell reception and wifi at the same time and literally can’t receive a page.
To acknowledge a page, go to incident.io or the #team-terminus-ff channel.
First Steps
Even though the Terminus team offers some services, much of what is handled by us is a proxy to other services usually provided by other Scala/Go/Node/etc teams. Therefore, before it is assumed to be a service that Terminus provides, some initial checks should be considered.
- Check Argo HPA autoscaling status for unhealthy or thrashing pods.
- Check startup logs in Honeycomb to see what might be killing the pods (e.g. something like this might be a good first step).
- Check the appropriate Terminus Grafana graphs for the current CPU and memory usage.
- Currently, the server resources provided for our team may not be enough in some circumstances to properly handle request loads.
- If it’s found to be a resources problem, you can modify the service’s app overrides in Banno Apps to scale out the
cpus,memand/orinstances. (Note: Because Node.js is single-threaded, the maxcpusvalue is1.0.) The infrastructure team can help deploy the change quickly.
- Check the appropriate Terminus Grafana for errors.
- These errors can give us an idea of which Node application is firing these errors.
- Check Honeycomb for the appropriate error message (e.g.
GatewayAuthError) or the status code (e.g. 500) that was returned.- Doing this can help the underlying service code owners to determine which path/app is messing up and how to fix it.
- If it’s not the fault of node-api-gateway, it can be handed off to the appropriate team(s).
- Check Honeycomb for 500s or other status codes.
- Clicking on a peak and viewing a trace may show you which spans have upstream services that may be returning errors to NAG.
If any of these solve the problem, take a second to breathe; you just fought the fire. 👩🚒🔥👨🚒
(Not really—you may have passed it off to someone else, but don’t stop celebrating the small wins. 🎉)
Second Steps
If none of the first steps solve the issue, then it is definitely our fire to fight. Even if the steps above seem tedious, they help determine which of our applications is causing the error and possibly why.
Consider if a deploy went out for the affected service shortly before the incident started. That could help point to the underlying cause, and provide a quick way to fix the problem (via rollback) until a more permanent fix is ready.
Checking the Grafana graphs helps determine which of our services or applications are failing. From there, search Honeycomb with a query such as
service = node-api-gateway message includes GatewayAuthError(example Honeycomb query). Gather a specific request ID for the failing request(s); it appears under the columnbanno.request.x_request_id.If the specific error message is not known, use
data.statusCodeto filter by HTTP status code (4xx,5xx), orseverityto show only errors. See Helpful Honeycomb Properties for relevant fields.Once you have found the request ID, you can do a simple search in Honeycomb such as this
banno.request.x_request_id:"<request ID>". For example, a request ID of6979871aa5454417bdf39f433efc1b0ccan be searched by replacing<request ID>with the number:banno.request.x_request_id:"6979871aa5454417bdf39f433efc1b0c". This query should return the logged requests with that ID to help determine information about the issue and why it may be happening and to be able to easily share the log(s) with others.Once you have the service, route, or issue causing the incident:
Check whether any feature flags are related to this repository or route.
Visit the production LaunchDarkly dashboard and read each flag’s description. It should list the service and affected routes where the flag applies. Use the filter to find flags for a repo (e.g.
node-consumer-login-proxy) or route (e.g./v1/users/:userId/dashboard).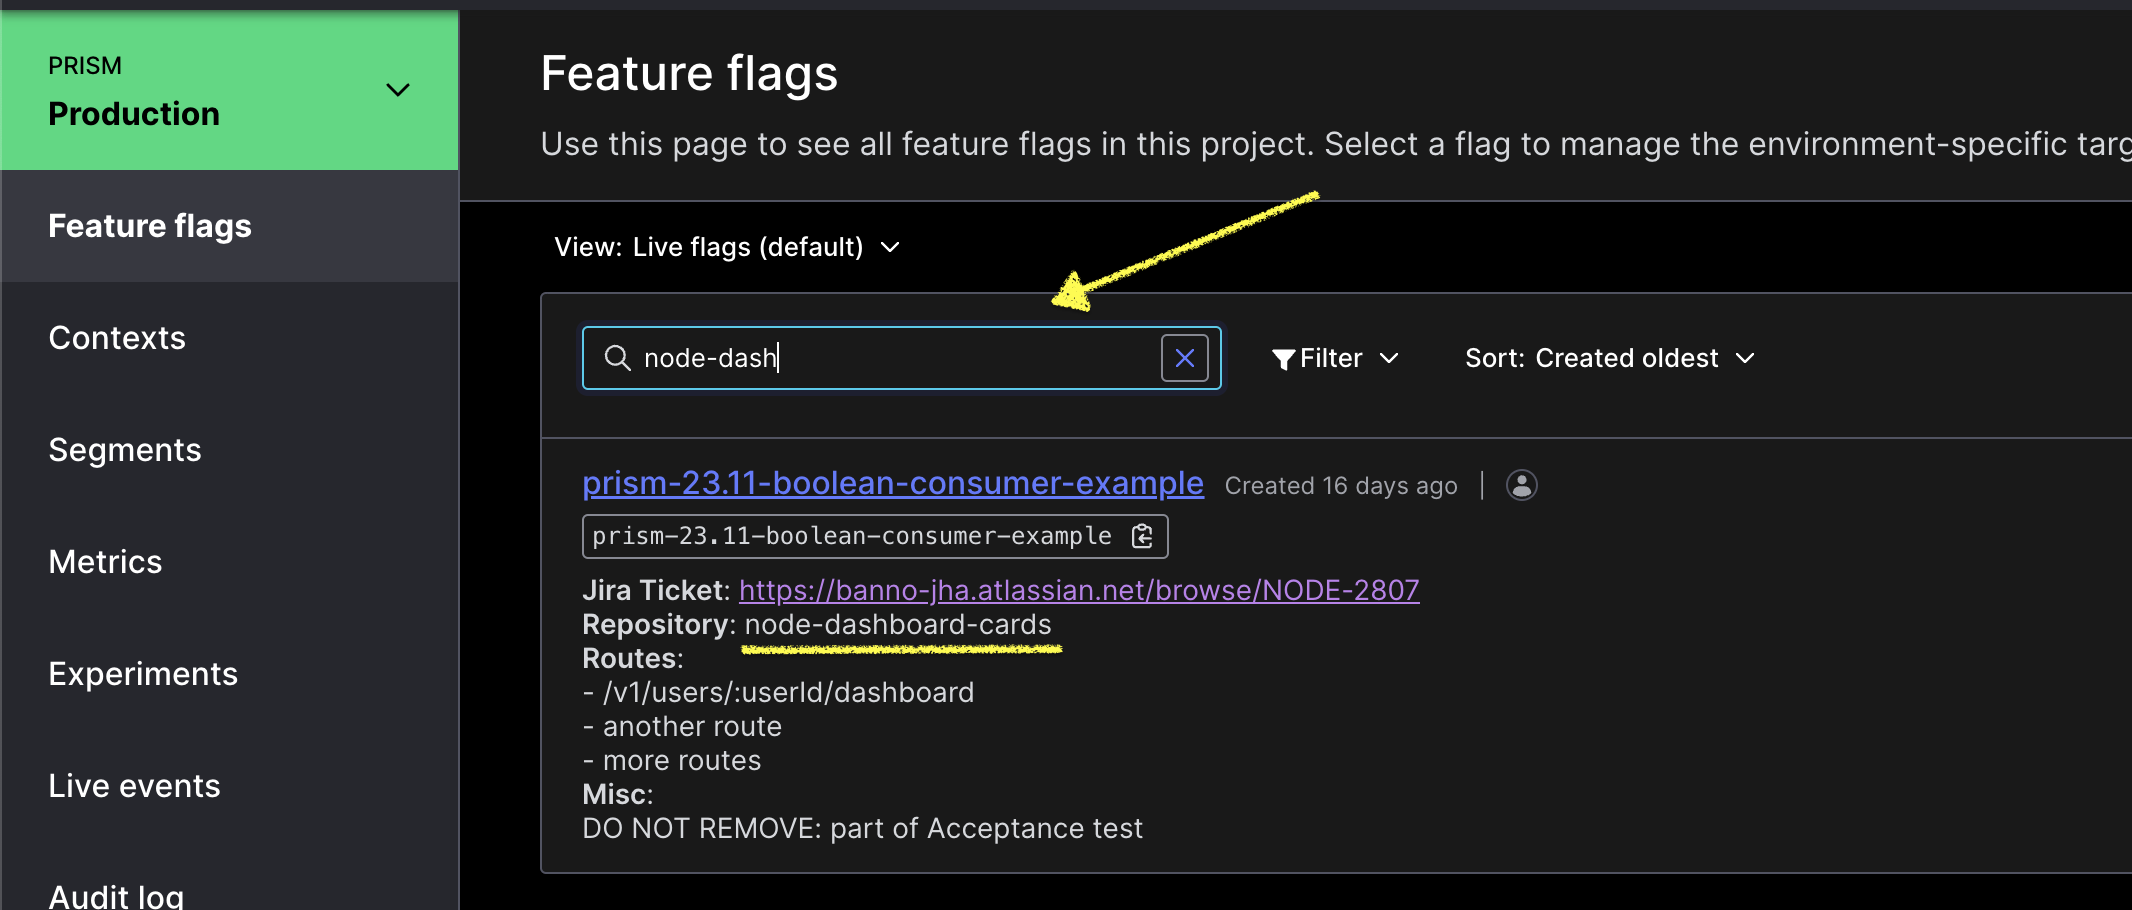
If a feature flag applies to the service and route, more research is warranted. If not, a feature flag most likely will not help.
The flag description should include a Jira ticket with details on the flag’s usage and intent.
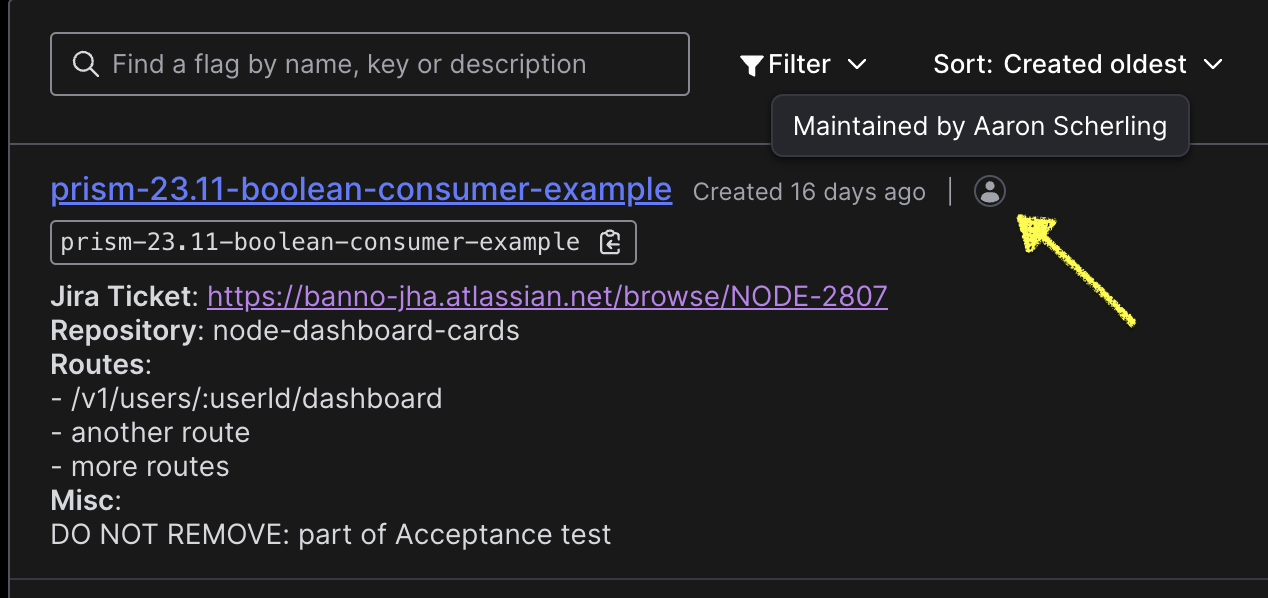
Reach out to the maintainer of the flag if more context is required. Find the maintainer in the LaunchDarkly dashboard:
When the feature flag is used within a
featureFlagWrapperfunction,funcAis the off behavior andfuncBis the on behavior.
Data Services Query Tool
The Data Services Query Tool is available for retrieving information on Tasks, Details, Users, and Institutions. Example uses include:
- Get userId by NettellerId
- Get Details by InstitutionId
- Get Tasks by userId/taskId within a given time range
Helpful Honeycomb Properties
Ensure you are in the node-api-gateway dataset. Set the query to name = service_request. This is the root span in the node-api-gateway.
Base Properties:
url.path- the non-sanitized urlhttp.route- the sanitized url of the requesthttp.response.status_code- the upstream service’s response codefeature_flags.*- feature flags used during the requesthttp.request.header.*- headers on the incoming requestk8s.pod.name- the name of the pod the request ran onmeta.refinery.reason- the reason the span was samplednag.route_definition.*- the route definition properties associated with the requesttrace.trace_id- the traceId associated with the requestrequestId/correlationId- the correlated ID for the logs
AuthN Properties:
banno.institution.id- the institutionId associated with the requestbanno.jwt.type- the type of JWT on the requestbanno.user.email- the user’s email on the JWTbanno.user.id- the user’s ID on the JWT
NAG Rate Limiting
During an incident, rate limiting in NAG may need to be adjusted. While this can be done by changing the USERS_INSTITUTION_MODEL_RATE_LIMITING environment variable via Banno Apps PR, any temporary adjustments to the rate limiting during an incident should be done by infrastructure (Dobby) as they can override the rate limit much faster than waiting for a Banno Apps PR to deploy.
Post Incident
Once an incident has been finished, there is an Incident Analysis and a Root Cause Analysis document to write up to capture what happened in the Incident.
The incident analysis is expected within 48 hours after the incident has been resolved, to capture as much as possible while it is fresh in your mind.
The root cause analysis is expected to be done within 2 weeks after the incident has been resolved. This should provide more detail and a deeper understanding of the issue as a whole.
For more information, see Banno’s incident response process.
Prometheus Alertmanager
The Prometheus Alertmanager can be found in the #team-terminus-ff Slack channel. The webhook posts inside of the channel when specific conditions are met (for more details, see this file). The value of the expr keys will contain the names of registered metrics that can be searched in their respective codebases. The different messages will be based on the rules and conditions.
Posts from Prometheus will look similar to this:
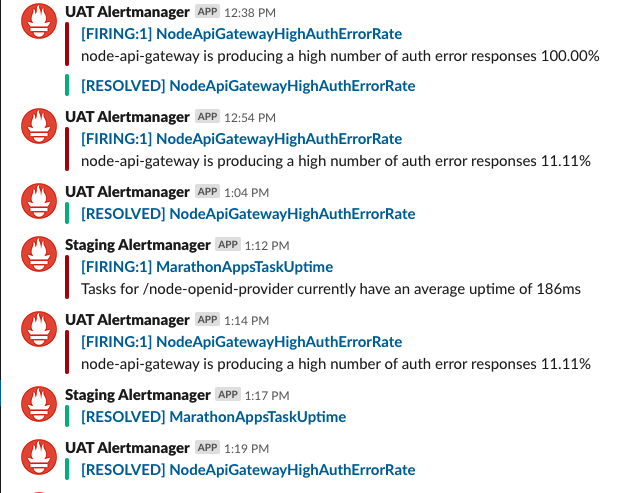
Prometheus gives both the application/service that is making the rule fire off as well as the specific rule that is firing. In the example, NodeApiGatewayHighAuthErrorRate has an expr that depends on the gateway_auth_errors_total Prometheus metric, which is incremented by code that also logs a GatewayHttpError and can be searched in Honeycomb. That lets you skip a few steps when determining the cause of the failure.
- For Kubernetes alerts, a helpful piece of information is the pod name when the group
dynamic-slackis expanded which can be used with kubectl/k9s to inspect logs.
Aside from telling us the error information, the name of the Prometheus webhook when posting is also which environment the error is occurring in: Staging, User Acceptance Testing (UAT), or Production. This can also be found from the environment in the URL of the Slack alert link (i.e. infra-gcp-us-central1.banno-staging.com).
Knowing this ensures that we are looking at the correct Grafana graphs and Honeycomb logs when determining the error’s request ID.
As a disclaimer, even though Prometheus has its uses for failing services, there will be times that it won’t be useful for every incident, so don’t rely on Prometheus to provide information or even be firing off if specific services aren’t working properly.
Rotation
Firefighter rotation is almost automatic:
- The incident.io schedules automatically rotates the firefighter every Monday.
- The
/inc oncallSlack list is automatically updated. - Team members must manually add or remove themselves from the Jira FF team and the Slack FF team at the start of each rotation.
- During rotation, a summary of OPS tickets must be provided for the next firefighter to take over on Monday, if it makes sense to transfer them to the next FF. Sometimes it might make more sense to hang on to a specific OPS issue after you’re done being FF if you’re best able to finish it or follow up—use your best judgment.
If you take PTO during your rotation, find another person to cover for you and add an override in incident.io.
Other incident/firefighting runbooks that have been created: